City Trend Dashboard
Vehicle Ownership Trends Over Years
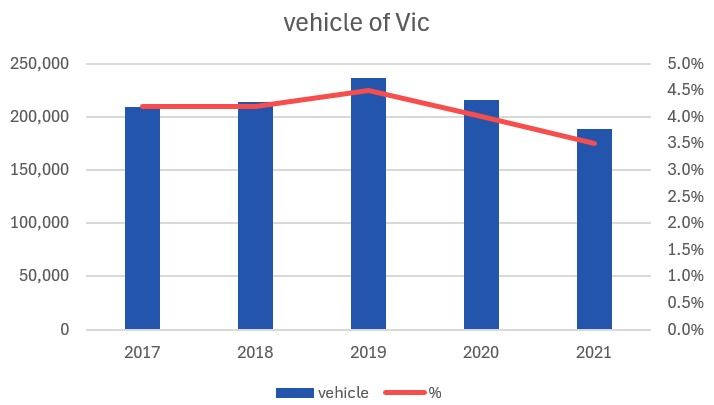
From 2017 to 2019, the number of vehicles in Victoria showed a steady upward trend, rising from just over 200,000 in 2017 to a peak of more than 225,000 in 2019. The corresponding percentage growth also reached its highest point in 2019 at around 4.3%, reflecting strong expansion in vehicle registrations during this period. However, from 2020 onwards, both vehicle numbers and growth percentages began to decline. By 2021, vehicle counts had fallen below 200,000 and the growth rate dropped to approximately 3.6%. This downward shift may be linked to the impacts of COVID-19 restrictions, reduced travel demand, and economic slowdowns, which likely influenced both consumer purchasing behaviour and overall vehicle usage in the state.
Total Vehicle Ownership
The ABS Total by Location chart shows that New South Wales has the highest count among the states, at around 1.3 million, followed by Victoria with approximately 1.05 million and Queensland with about 700,000. Western Australia and South Australia have moderate totals of roughly 350,000 and 200,000 respectively, while Tasmania, the Northern Territory, and the ACT record minimal counts under 100,000. The combined national total for Australia is close to 3.8 million, reflecting the strong concentration of activity in the larger eastern states.